

Finance for Founders - Customer and revenue retention

Introduction
Part 1 of this series covered the sales funnel - how leads move through the pipeline, turn into won deals and flow as revenue into the P&L. Part 2 explores what happens with these customers in the future. Do their revenues expand or contract? Do they stay with the business or churn? How do investors assess a company’s health using KPIs like Gross- and Net Revenue Retention (GRR/NRR)?
Retaining customers
Most models will start with the number of customers a business had in the previous period (the “opening base”). Add newly acquired customers, subtract churning customers, leaving the number of customers in the current period (the “closing base”).
Since it is unknown on what day of the month acquisition and churn happen, models commonly calculate the average number of customers for any given period. This workaround implies that any customer changes happen evenly throughout the month. If your contracts always begin on the first and end at the last day of the month, this step can be skipped.
The table below shows an example of calculating the average customer base:
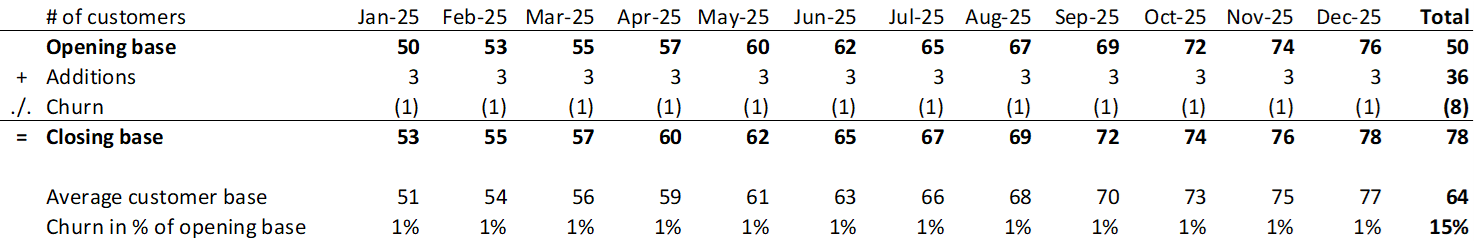
The so-called “logo retention” simply assesses how many customers a business is left with after accounting for churn. In the example 50 - 8 = 42 or 84% after a year. Private SaaS companies tend to churn 10-20% of their logos annually (0.87-1.85% monthly).
If your customers sign up for multi-year contracts or have long notice periods, the churn pattern can differ, even more so whilst the business still has only a few customers. A list of renewal dates can help spotting the months in which churn is likely highest. As businesses scale, renewal dates tend to spread out more evenly.
Your Management Reporting is a great foundation to calculate historical churn. Once the revenues of a customer stop, they presumably churned. Exceptions apply in businesses where customers can fall “inactive” before being either reactivated or churning. Adding these steps into the calculation avoids conflating new customers with reactivated customers - which becomes particularly important when calculating Customer Acquisition Costs and Customer Lifetime Value.
Churn tends to be involuntary - who wants to lose customers? In rarer cases, businesses voluntarily churn customers, e.g. due to negative unit economics or bad payment morale. If voluntary churn accounts for a noticeable amount of revenue, it can be worth excluding it from the calculation of churn rates.
Retaining and expanding revenues
Modelling a customer's average monthly recurring revenue (MRR) follows the same logic. Starting with the MRR in the previous month, revenues can:
Expand due to: pricing negotiations, switching to expensive tiers, increased volumes (volume-based pricing), purchasing of additional seats, selling additional products (cross-sell)
Contract due to the opposite of any of the above examples
It can be useful to track more granular categories than simply “Expansion” and “Contraction” - some examples:
Two recently merged businesses could model cross-sell (and product churn) separately to evidence synergies.
A business focusing on growth within existing customers could isolate seat expansion and seat contraction.
Unfortunately, this requires tracking actual performance using the same logic. Companies often struggle when categories overlap or definitions are vague. A statement like “Yes, this number suggests that [...], but what really happened is [...].” is a common red flag for being too granular or too academic.
The table below gives an example for a simplified MRR calculation:
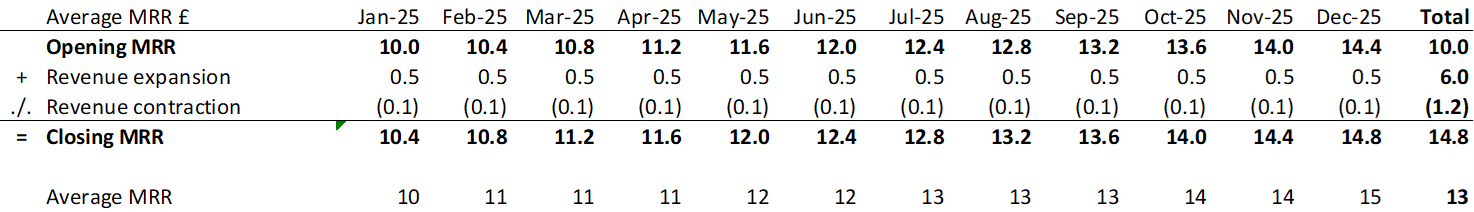
* Note that the average annual MRR has to be calculated based on weighted averages. A linear monthly average will miss accounting for the changing number of customers.
Tracking revenue expansion and contraction often requires information that does not live in the accounting system. GAAP-revenues easily conflate a price increase with product churn. The CRM system serves as the source of truth for the next level of details (e.g. number of seats, price per seat, products purchased etc.), but requires to tie the sum of all revenues back to the P&L.
KPIs and benchmarks
Investors commonly prioritise two KPIs to assess the health of a SaaS business: Gross Revenue Retention (GRR) and Net Revenue Retention (NRR).
GRR measures how much of the contractually agreed revenue at the beginning of a period is retained over time. It excludes any new customers and revenue expansion and focuses on the “revenue leakage” from logo churn and revenue contraction.
Building on the previous example, calculating GRR for the full year:
Opening MRR = 50 x 10 = 500
Logo churn = 8 x 13 = 104 (8 churned customers x 13 average MRR x 12 months)
Revenue contraction = 42 x 1.2 = 50 (42 remaining customers x 1.2 average annual contraction)
The business retains 346 (500 - 104 - 50) out of the 500 starting MRR (~69%)
NRR measures the retained revenue including revenue expansion, hence accounting for any improvements to pricing, customer penetration or cross sell of other products. NRR effectively allows to compensate for revenue contraction in one area of the business with revenue expansion in other areas. Same as the GRR, the NRR excludes newly acquired customers.
Taking the previous example, calculating NRR for the full year:
Opening MRR = 50 x 10 = 500
Logo churn = 8 x 13 = 104 (8 churned customers x 13 average MRR x 12 months),
Revenue contraction = 42 x 1.2 = 50 (42 remaining customers x 1.2 average annual contraction)
Revenue expansion = 42 x 6.0 = 252 (42 remaining customers x 6.0 average annual contraction)
The business retains 598 (500 - 104 - 50 +252) out of the 500 starting MRR (~120%)
Keen observers will notice an important caveat to this approach. It assumes that the MRR changes (expansion and contraction) apply to the opening cohort, i.e. the 50 customers the business has on 1st of Jan-25. This can be misleading if the business expands into new customer segments and expects future revenue expansion to be driven by those new customers.
An alternative approach - Cohorts
Businesses with high growth rates or a changing customer focus can particularly benefit from tracking cohorts. A cohort view groups customers by the month in which they were acquired and measures their revenue over time. This approach allows to spot if recently acquired customers perform better or worse than previously acquired ones.
The table below shows an example:

Conclusion
If winning customers is one side of the coin that makes the success of a SaaS business, retaining those customers and expanding their revenues is the other.
Your business model will determine:
the appropriate level of detail when measuring revenue expansion and contraction
if a cohort view may be preferable all together
how much emphasis to put on seasonality
if you track and forecast all customers together or segment them into groups (e.g. by customer size, industry or region)
Once implemented, this data will serve as your foundation for the important GRR and NRR calculations that investors expect. Keep in mind that GRR and NRR are lagging indicators - they show what happened after it happened. To increase foresight, consider tracking daily or monthly active users (even in B2B SaaS), Net Promoter Scores and feature adoption rates. These in combination with quarterly customer reviews, led by your Account Managers, will equip you sufficiently to estimate future revenue retention and churn.
No matter how well your sales engine is running, revenue retention and expansion are the real long term value drivers. Adding sensitivity analyses and scenarios to your financial model helps illustrating this relation:
How does the business valuation in 3 years change, if we increase retention by 20%?
How viable is the business in an economic downturn where the number of seats contracts by 30%?
If you struggle to forecast revenue retention, let’s connect and discuss how to implement those metrics for your business model.